Your company’s success hinges on managing millions of data daily—each one crucial to keeping operations running smoothly and maintaining regulatory compliance. Yet, all this data is scattered across multiple systems, overwhelming teams and leaving critical decisions vulnerable to delays or errors. Data overload can lead to costly mistakes and missed opportunities in industries like oil & gas, pharmaceuticals, and manufacturing, where precision is everything.
This is where data visualization steps in. By transforming complex, overwhelming datasets into clear, actionable insights, businesses can use the power of their data to make smarter, faster decisions—and gain a competitive edge in the process.
What is Data Visualization?
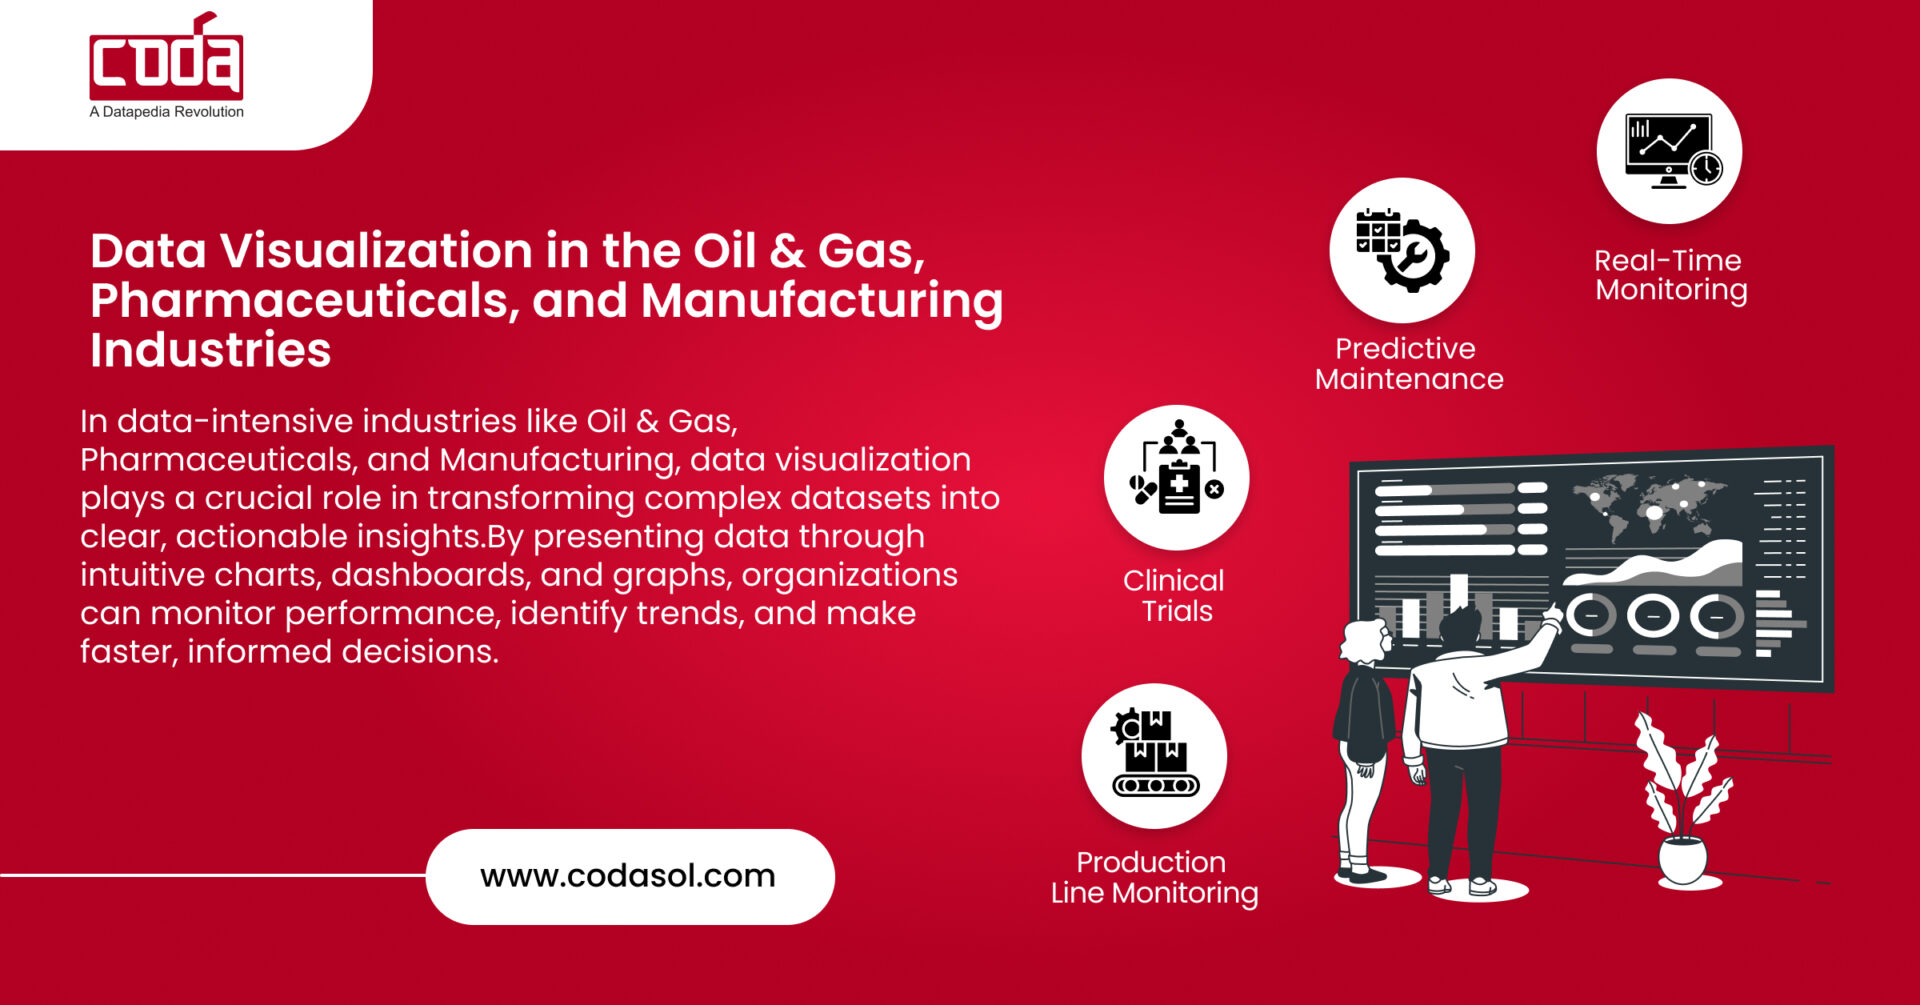
Data visualization refers to the graphical representation of data through charts, graphs, dashboards, heat maps, and other visual tools. It simplifies complex datasets, making it easier for decision-makers to grasp patterns, trends, and outliers quickly. For industries dealing with high-stakes operations like oil exploration, drug development, or manufacturing optimization, data visualization is more than just a tool—it’s a strategic advantage.
According to a report by MarketsandMarkets, the global data visualization tools market is expected to grow from $8.85 billion in 2020 to $19.20 billion by 2026, underscoring the increasing reliance on visual analytics across industries.
How Data Visualization Transforms Key Industries
1. Optimizing Oil & Gas Operations with Data Visualization
In the oil & gas industry, where the margin for error is slim and decisions have multi-million dollar consequences, data visualization provides critical insights into every aspect of the supply chain, from exploration to refining.
Exploration & Drilling:
3D visualizations of geological and seismic data provide a clearer view of potential drilling sites. This reduces the risk of unnecessary exploration by up to 30%, saving millions in operational costs.
Real-Time Monitoring:
Dashboards displaying real-time metrics like pressure, flow rate, and equipment status help identify bottlenecks before they escalate into costly shutdowns. For example, a pipeline rupture can cost oil companies up to $1.4 million per day in lost production. With predictive monitoring, these issues can be preemptively addressed.
Risk Control:
Data visualization tools help track environmental risks, such as oil spills or gas leaks, in real time. Visual dashboards have proven to reduce environmental non-compliance incidents by 20% due to early detection and intervention.
Predictive Maintenance:
By analyzing equipment performance through charts and graphs, operators can foresee equipment failures, reducing maintenance costs by as much as 25% while increasing uptime and production efficiency.
2. Enhancing Drug Development through Data Visualization
The pharmaceutical industry generates massive amounts of data from clinical trials, drug formulations, and patient records. The complexity of this data can be overwhelming without proper visualization tools.
Clinical Trials:
Visual tools help researchers quickly spot trends in patient outcomes, treatment efficacy, and adverse reactions, leading to more informed decisions. Studies have shown that visual dashboards in clinical trials can reduce data analysis time by up to 50%, accelerating the drug approval process.
Drug Development:
Tools like scatter plots and heat maps enable scientists to visualize complex interactions between chemical compounds, helping identify successful drug formulations faster. This accelerates time-to-market by as much as 30% in some cases.
Regulatory Compliance:
In an industry governed by strict regulations, visualization tools provide a clear view of critical compliance metrics, reducing non-compliance penalties by 15-20% through better audit preparedness.
Supply Chain Management:
Pharmaceutical companies can visualize their entire supply chain, from raw material sourcing to distribution, allowing them to identify and address bottlenecks in real-time. This improves on-time delivery rates by 25% and reduces supply chain costs by 10%.
3. Improving Manufacturing Efficiency with Real-Time Insights
For the manufacturing industry, where efficiency and uptime are critical, data visualization plays a vital role in optimizing production processes and improving product quality.
Production Line Monitoring:
Real-time metrics and visual dashboards enable plant managers to monitor machine performance, quality control, and waste reduction. Studies have shown that manufacturers using data visualization have seen an average of 20% improvement in production efficiency.
Inventory Optimization:
Visual dashboards help manufacturers optimize inventory levels, reordering points, and capacity planning. Predictive analysis can forecast machinery failures and ensure optimal performance, leading to inventory cost reductions of up to 15%.
Streamlined Operations:
Graphical representations of production workflows and plant operations provide actionable insights that streamline processes. By visualizing KPIs, manufacturers can cut down production cycle times by 10-15%, driving overall efficiency.
Key Components of Effective Data Visualization Across These Industries
To fully leverage the power of data visualization in industries like oil & gas, pharmaceuticals, and manufacturing, several key elements are essential:
Precision and Clarity:
Effective visualizations should be clear and simple, ensuring that stakeholders can quickly grasp critical insights. Misinterpretation can lead to costly decisions, particularly in high-stakes industries like oil & gas.
Relevance:
Industry-specific visualizations—like geospatial mapping for oil exploration or heat maps for drug development—are crucial. Ensuring the relevance of data visualizations strengthens decision-making across these verticals.
Customization:
Different departments may require different visual representations. For example, an operations team may prioritize real-time metrics, while the finance team may need a high-level overview of cost savings. Customizable dashboards ensure the right data is delivered to the right people.
Consistency:
Maintaining a consistent design and visual language across reports and dashboards enhances user experience and reduces the learning curve for employees.
Accessibility:
No matter the technical expertise of the viewer, visualizations should be accessible and easy to interpret, allowing all relevant personnel to gain insights and take appropriate action.
Final Thoughts
Data visualization has revolutionized how the oil & gas, pharmaceutical, and manufacturing industries manage and interpret complex data. By turning data into visually digestible insights, companies can make faster, more informed decisions that improve efficiency, reduce costs, and drive business growth. Whether it’s avoiding unnecessary exploration in oil fields, accelerating drug development, or optimizing production lines, the power of data visualization is undeniable.
As industries continue to evolve in the digital age, the ability to harness data through visual tools will be a game-changer for those looking to stay ahead in competitive markets.

Want to transform your business operations with cutting-edge Data Visualization Tools and learn actionable insights from your data to drive growth in your organization?

